The scientists' development will provide more accurate models of urbanization.
Scientists from Germany have created the most complete digital representation of the planet's anthropogenic environment for the first time, compiling a large-scale 3D dataset that includes 2.75 billion buildings. The GlobalBuildingAtlas, developed by a research team from the Technical University of Munich (TUM), opens new opportunities for advanced climate research and contributes to the achievement of the United Nations Sustainable Development Goals.
Professor and head of the Data Science in Earth Observation department, Dr. Xiaoxian Zhu at the Technical University of Munich, who led the project, noted that the new map should provide more accurate models for urbanization, emergency management, and infrastructure planning, as well as help cities become more inclusive and sustainable.
Each building on the new map is represented with a resolution of three by three meters. According to the developers, this level of accuracy allows for reliable assessments of height, volume, and structural density of the built environment.
Additionally, 97 percent of all objects belong to Level of Detail (LoD) 1 models. These are simplified three-dimensional models that convey the basic geometry of a building. Although their detail is lower than that of higher LoD models, they are well-suited for large-scale integration into computational models. Zhu emphasized that such data provide a solid foundation for analyzing urban structure, calculating volumes, and planning infrastructure.
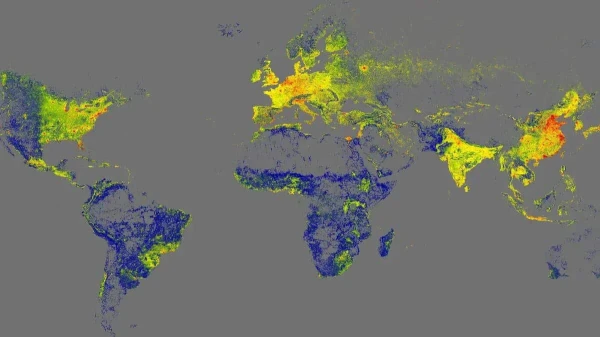
Unlike previous datasets that primarily covered cities in developed countries, the new map provides extensive information about regions that were previously underrepresented in digital maps: countries in Africa, South America, Southeast Asia, as well as rural areas around the world.
Zhu explained that 3D data on buildings more accurately reflect the level of urbanization and poverty than two-dimensional maps. In three-dimensional models, researchers can see not only the footprint of the buildings but also the volume of each structure, allowing for a much more precise assessment of living conditions.
The scientists also introduced a new indicator — building volume per capita. This global indicator measures the total construction volume per person and reveals social and economic disparities.
Three-dimensional data on construction provide an accurate basis for planning and monitoring urban development. They will help cities take targeted steps to create more equitable living conditions — for example, by expanding the housing stock or adding social facilities in densely populated, underserved areas.
<iframe width="560" height="315" src="https://www.youtube.com/embed/9_1oMHdahyM?si=TC4jaSdfWjEr0JIr" title="YouTube video player" frameborder="0" allow="accelerometer; autoplay; clipboard-write; encrypted-media; gyroscope; picture-in-picture; web-share" referrerpolicy="strict-origin-when-cross-origin" allowfullscreen></iframe>